
Seattle Monthly Housing Report
Seattle Housing Market Report
August 2026 | Standout Homes Sparked Serious Competition
Quick Take
Seattle Buyers Had Choices, and the Details Mattered
Seattle had 3172 homes for sale in July, 20.3% higher than one year earlier. Pending sales were 5.8% lower.
Housing type and price range changed the experience. The sections below compare residential resale, new construction, condos, townhouses, and every supplied resale price point.
My bottom line: Buyers responded when price, condition, location, presentation, and rarity gave them a clear reason to act.
What Happened Across Seattle in July 2026?
This section covers all Seattle property types reported by the NWMLS. The housing-type and resale sections below show why the citywide average did not describe every buyer or seller.
Seattle Whole-City Snapshot
Seattle | July 2026
- Homes for sale
- 3172 July 2025: 2636 | 20.3% higher
- Went under contract
- 749 July 2025: 795 | 5.8% lower
- Closed sales
- 697 July 2025: 815 | 14.5% lower
- Time to contract*
- 13 days July 2025: 12 days | 1 days slower
- Original asking received*
- 99.2% July 2025: 99.2% | unchanged
- Median sales price
- $879,500 July 2025: $853,000 | 3.1% higher
Seattle Whole-City Snapshot had 3172 homes available, 749 pending sales, and 697 closings. Successful sales took 13 days. The middle seller retained 99.2% of original asking price.
Listings That Did Not Sell
647 Seattle Listings Did Not Sell
These listings left the market without a completed sale. Buyer activity did not guarantee success when price, condition, presentation, or direct competition created resistance.
Next, compare condos, townhouses, and new construction.
Continue to housing types →How Did Seattle Housing Types Perform?
Residential resale, new construction, condominiums, and townhouses produced materially different timelines, price results, and negotiating conditions during July.
Residential Resale
Seattle | July 2026 | Price ranges combined
- Homes for sale
- 448 July 2025: 395 | 13.4% higher
- Went under contract
- 226 July 2025: 247 | 8.5% lower
- Closed sales
- 219 July 2025: 246 | 11.0% lower
- Price ranges analyzed
- 5 All supplied residential resale ranges
- Fastest successful range
- $1.05M to $1.35M 5 median days
- Strongest asking-price range
- $1.35M or More 100.6% of original asking
This overview totals activity across every supplied residential resale price range. Median timing and pricing are shown within each range below because separate medians cannot be combined accurately.
Seattle Residential Resale Summary for July 2026
Across the supplied price ranges, buyers had 448 homes to consider, 226 went pending, and 219 closed.
The price-range cards below preserve the median timing, asking-price result, sales price, price per square foot, and showings within the range where each statistic actually belongs.
New Construction
Seattle | July 2026
- Homes for sale
- 612 July 2025: 442 | 38.5% higher
- Went under contract
- 109 July 2025: 96 | 13.5% higher
- Closed sales
- 93 July 2025: 94 | 1.1% lower
- Time to contract*
- 24 days July 2025: 14 days | 10 days slower
- Original asking received*
- 100.0% July 2025: 100.0% | unchanged
- Median sales price
- $825,000 July 2025: $832,475 | 0.9% lower
New Construction had 612 homes available, 109 pending sales, and 93 closings. Successful sales took 24 days. The middle seller retained 100.0% of original asking price.
Seattle New Construction Summary for July 2026
Compared with July 2025, inventory was 38.5% higher, pending sales were 13.5% higher, and closings were 1.1% lower.
Timing was 10 days slower and the asking-price result was unchanged. These figures describe successful sales, so property mix, condition, location, and direct competition still matter.
Condominiums
Seattle | July 2026
- Homes for sale
- 1014 July 2025: 893 | 13.5% higher
- Went under contract
- 152 July 2025: 164 | 7.3% lower
- Closed sales
- 144 July 2025: 168 | 14.3% lower
- Time to contract*
- 34 days July 2025: 28 days | 6 days slower
- Original asking received*
- 96.6% July 2025: 97.1% | 0.5 points lower
- Median sales price
- $499,450 July 2025: $440,000 | 13.5% higher
Condominiums had 1014 homes available, 152 pending sales, and 144 closings. Successful sales took 34 days. The middle seller retained 96.6% of original asking price.
Seattle Condominiums Summary for July 2026
Compared with July 2025, inventory was 13.5% higher, pending sales were 7.3% lower, and closings were 14.3% lower.
Timing was 6 days slower and the asking-price result was 0.5 points lower. These figures describe successful sales, so property mix, condition, location, and direct competition still matter.
Townhouses
Seattle | July 2026
- Homes for sale
- 372 July 2025: 285 | 30.5% higher
- Went under contract
- 78 July 2025: 88 | 11.4% lower
- Closed sales
- 62 July 2025: 90 | 31.1% lower
- Time to contract*
- 14 days July 2025: 25 days | 11 days faster
- Original asking received*
- 99.0% July 2025: 97.6% | 1.4 points higher
- Median sales price
- $719,975 July 2025: $724,975 | 0.7% lower
Townhouses had 372 homes available, 78 pending sales, and 62 closings. Successful sales took 14 days. The middle seller retained 99.0% of original asking price.
Seattle Townhouses Summary for July 2026
Compared with July 2025, inventory was 30.5% higher, pending sales were 11.4% lower, and closings were 31.1% lower.
Timing was 11 days faster and the asking-price result was 1.4 points higher. These figures describe successful sales, so property mix, condition, location, and direct competition still matter.
Next, see how residential resale changed across five price ranges.
Continue to price ranges →How Did Seattle Residential Resale Price Ranges Perform?
Each price range below keeps its July inventory, buyer activity, successful-sale speed, showings, negotiation result, and interpretation together.
Under $700K
Seattle | July 2026
- Homes for sale
- 117 July 2025: 86 | 36.0% higher
- Went under contract
- 53 July 2025: 55 | 3.6% lower
- Closed sales
- 53 July 2025: 54 | 1.9% lower
- Time to contract*
- 10 days July 2025: 11 days | 1 days faster
- Original asking received*
- 100.0% July 2025: 99.1% | 0.9 points higher
- Median sales price
- $580,000 July 2025: $600,000 | 3.3% lower
Under $700K had 117 homes available, 53 pending sales, and 53 closings. Successful sales took 10 days. The middle seller retained 100.0% of original asking price.
Seattle Under $700K Summary for July 2026
Compared with July 2025, inventory was 36.0% higher, pending sales were 3.6% lower, and closings were 1.9% lower.
Timing was 1 days faster and the asking-price result was 0.9 points higher. These figures describe successful sales, so property mix, condition, location, and direct competition still matter.
$700K to $849K
Seattle | July 2026
- Homes for sale
- 99 July 2025: 82 | 20.7% higher
- Went under contract
- 34 July 2025: 40 | 15.0% lower
- Closed sales
- 36 July 2025: 52 | 30.8% lower
- Time to contract*
- 8 days July 2025: 9 days | 1 days faster
- Original asking received*
- 100.0% July 2025: 100.0% | unchanged
- Median sales price
- $773,500 July 2025: $772,500 | 0.1% higher
$700K to $849K had 99 homes available, 34 pending sales, and 36 closings. Successful sales took 8 days. The middle seller retained 100.0% of original asking price.
Seattle $700K to $849K Summary for July 2026
Compared with July 2025, inventory was 20.7% higher, pending sales were 15.0% lower, and closings were 30.8% lower.
Timing was 1 days faster and the asking-price result was unchanged. These figures describe successful sales, so property mix, condition, location, and direct competition still matter.
$850K to $1.05M
Seattle | July 2026
- Homes for sale
- 102 July 2025: 90 | 13.3% higher
- Went under contract
- 57 July 2025: 61 | 6.6% lower
- Closed sales
- 50 July 2025: 49 | 2.0% higher
- Time to contract*
- 9 days July 2025: 6 days | 3 days slower
- Original asking received*
- 100.0% July 2025: 100.0% | unchanged
- Median sales price
- $924,000 July 2025: $945,000 | 2.2% lower
$850K to $1.05M had 102 homes available, 57 pending sales, and 50 closings. Successful sales took 9 days. The middle seller retained 100.0% of original asking price.
Seattle $850K to $1.05M Summary for July 2026
Compared with July 2025, inventory was 13.3% higher, pending sales were 6.6% lower, and closings were 2.0% higher.
Timing was 3 days slower and the asking-price result was unchanged. These figures describe successful sales, so property mix, condition, location, and direct competition still matter.
$1.05M to $1.35M
Seattle | July 2026
- Homes for sale
- 59 July 2025: 63 | 6.3% lower
- Went under contract
- 42 July 2025: 50 | 16.0% lower
- Closed sales
- 43 July 2025: 50 | 14.0% lower
- Time to contract*
- 5 days July 2025: 6 days | 1 days faster
- Original asking received*
- 100.0% July 2025: 100.0% | unchanged
- Median sales price
- $1,181,416 July 2025: $1,167,500 | 1.2% higher
$1.05M to $1.35M had 59 homes available, 42 pending sales, and 43 closings. Successful sales took 5 days. The middle seller retained 100.0% of original asking price.
Seattle $1.05M to $1.35M Summary for July 2026
Compared with July 2025, inventory was 6.3% lower, pending sales were 16.0% lower, and closings were 14.0% lower.
Timing was 1 days faster and the asking-price result was unchanged. These figures describe successful sales, so property mix, condition, location, and direct competition still matter.
$1.35M or More
Seattle | July 2026
- Homes for sale
- 71 July 2025: 74 | 4.1% lower
- Went under contract
- 40 July 2025: 41 | 2.4% lower
- Closed sales
- 37 July 2025: 41 | 9.8% lower
- Time to contract*
- 6 days July 2025: 6 days | unchanged
- Original asking received*
- 100.6% July 2025: 100.0% | 0.6 points higher
- Median sales price
- $1,605,000 July 2025: $1,600,000 | 0.3% higher
$1.35M or More had 71 homes available, 40 pending sales, and 37 closings. Successful sales took 6 days. The middle seller retained 100.6% of original asking price.
Seattle $1.35M or More Summary for July 2026
Compared with July 2025, inventory was 4.1% lower, pending sales were 2.4% lower, and closings were 9.8% lower.
Timing was unchanged and the asking-price result was 0.6 points higher. These figures describe successful sales, so property mix, condition, location, and direct competition still matter.
You’ve completed the detailed market breakdown. Continue with common questions.
Continue to questions →Neighborhood Competition
Seattle Neighborhood Competition and Standout Sales
One thing that really jumped out at me was not just that buyers competed. It was where they competed. These standout sales were not clustered in one Seattle neighborhood or one price range. They showed up in Queen Anne, Wallingford, Bryant, Ballard, West Seattle, Greenwood, Beacon Hill, the Central District, and beyond.
Wow...a renovated North Queen Anne home listed at $2.295 million sold in two days for $2.565 million, approximately 11.76% over asking. In Hawthorne Hills, a home listed at $2.395 million sold in five days for $2.640 million, about $245,000 and 10.23% over asking.
Along Brace Point Cove in Fauntleroy, a home listed at $2.795 million sold in four days for $2.935 million, approximately $140,000 over asking. A midcentury design near Sand Point Country Club listed at $2.8 million sold for $2.925 million, about 4.46% over asking.
The competition was not limited to the upper end. A Greenwood bungalow moved from $865,000 to $965,000 in seven days, about 11.56% over asking. A Central District home listed at $799,000 sold for $933,500 in five days, approximately 16.83% over asking. A Beacon Hill home listed at $788,000 sold for $869,000, about 10.28% over asking.
Different buyers wanted different kinds of homes, but they responded the same way when a property was beautifully presented, thoughtfully updated, priced well, or simply offered something they got excited about. These were standout results, not the result every seller received, and the 647 failed listings make that distinction very clear.
Questions Raised by the Data
What Does Seattle's July Market Actually Mean?
Does the citywide median describe every Seattle home?
No. The citywide figures combine different housing types, sizes, conditions, locations, and price ranges. A specific home should be compared with similar properties and its direct competition.
Where did successful residential resale homes move fastest?
The $1.05M to $1.35M range had a median of 5 days among successful sales. That result describes the middle successful sale in that range, not every active listing.
Why can buyers have choices while some homes still receive strong offers?
More inventory gives buyers permission to compare. Homes can still create competition when their price, condition, location, presentation, lot, or rarity makes them stand out from the alternatives.
Complete Market Conclusion
Seattle Housing Market Conclusion for July 2026
Seattle was not one market. Housing type, price range, and the individual property changed the result.
Citywide inventory was 20.3% higher, pending sales were 5.8% lower, and closings were 14.5% lower than in July 2025.
The median successful sale took 13 days and received 99.2% of original asking price. Median sale price was $879,500 and median price per square foot was $541.
New Construction: 612 homes were available, 109 went pending, and 93 closed. The successful median was 24 days. The middle seller received 100.0% of asking.
Condominiums: 1014 homes were available, 152 went pending, and 144 closed. The successful median was 34 days. The middle seller received 96.6% of asking.
Townhouses: 372 homes were available, 78 went pending, and 62 closed. The successful median was 14 days. The middle seller received 99.0% of asking.
The resale price ranges below show why the citywide average did not describe every seller. Fast timing or a strong asking-price result in a small sample should be treated as evidence about those particular successful sales, not as a guarantee for every listing.
Under $700K: 117 homes were available, 53 went pending, and 53 closed. Successful sales took 10 days. The middle seller received 100.0% of asking.
$700K to $849K: 99 homes were available, 34 went pending, and 36 closed. Successful sales took 8 days. The middle seller received 100.0% of asking.
$850K to $1.05M: 102 homes were available, 57 went pending, and 50 closed. Successful sales took 9 days. The middle seller received 100.0% of asking.
$1.05M to $1.35M: 59 homes were available, 42 went pending, and 43 closed. Successful sales took 5 days. The middle seller received 100.0% of asking.
$1.35M or More: 71 homes were available, 40 went pending, and 37 closed. Successful sales took 6 days. The middle seller received 100.6% of asking.
If I had to sum up Seattle in one sentence: buyers had choices, but they still acted when a home made its value, condition, location, or uniqueness clear.
Questions About Your Plans?
Talk With Brandice
I represent buyers and sellers throughout Seattle, Snohomish County, King County, and surrounding communities.
Never Miss the Next Update
Get the Monthly Market Briefing
Receive new city reports, local market shifts, competition insights, and practical takeaways for buyers and sellers. One useful email each month.
 Facebook
 X
X
 Pinterest
 Copy Link
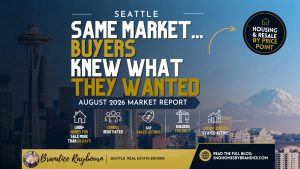







Seattle Seattle Whole-City Snapshot Summary for July 2026
Compared with July 2025, inventory was 20.3% higher, pending sales were 5.8% lower, and closings were 14.5% lower.
Timing was 1 days slower and the asking-price result was unchanged. These figures describe successful sales, so property mix, condition, location, and direct competition still matter.