
 Facebook
 X
X
 Pinterest
 Copy Link
Marysville Monthly Housing Report
Marysville Housing Market Report
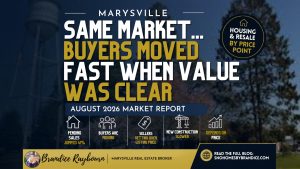
August 2026 | Buyers Moved Fast When the Value Was Clear
Quick Take
Marysville Buyers Had Choices, and the Details Mattered
Marysville had 331 homes for sale in July, 40.9% higher than one year earlier. Pending sales were 40.7% higher.
Housing type and price range changed the experience. The sections below compare residential resale, new construction, condos, townhouses, and every supplied resale price point.
My bottom line: Buyers responded when price, condition, location, presentation, and rarity gave them a clear reason to act.
What Happened Across Marysville in July 2026?
This section covers all Marysville property types reported by the NWMLS. The housing-type and resale sections below show why the citywide average did not describe every buyer or seller.
Marysville Whole-City Snapshot
Marysville | July 2026
- Homes for sale
- 331 July 2025: 235 | 40.9% higher
- Went under contract
- 121 July 2025: 86 | 40.7% higher
- Closed sales
- 101 July 2025: 95 | 6.3% higher
- Time to contract*
- 13 days July 2025: 13 days | unchanged
- Original asking received*
- 99.4% July 2025: 99.4% | unchanged
- Median sales price
- $610,000 July 2025: $625,000 | 2.4% lower
Marysville Whole-City Snapshot had 331 homes available, 121 pending sales, and 101 closings. Successful sales took 13 days. The middle seller retained 99.4% of original asking price.
Listings That Did Not Sell
25 Marysville Listings Did Not Sell
These listings left the market without a completed sale. Buyer activity did not guarantee success when price, condition, presentation, or direct competition created resistance.
Next, compare condos, townhouses, and new construction.
Continue to housing types →How Did Marysville Housing Types Perform?
Residential resale, new construction, condominiums, and townhouses produced materially different timelines, price results, and negotiating conditions during July.
Residential Resale
Marysville | July 2026
- Homes for sale
- 122 July 2025: 104 | 17.3% higher
- Went under contract
- 57 July 2025: 53 | 7.5% higher
- Closed sales
- 54 July 2025: 52 | 3.8% higher
- Time to contract*
- 10 days July 2025: 7 days | 3 days slower
- Original asking received*
- 100.0% July 2025: 100.0% | unchanged
- Median sales price
- $614,500 July 2025: $635,000 | 3.2% lower
Residential Resale had 122 homes available, 57 pending sales, and 54 closings. Successful sales took 10 days. The middle seller retained 100.0% of original asking price.
Marysville Residential Resale Summary for July 2026
Compared with July 2025, inventory was 17.3% higher, pending sales were 7.5% higher, and closings were 3.8% higher.
Timing was 3 days slower and the asking-price result was unchanged. These figures describe successful sales, so property mix, condition, location, and direct competition still matter.
New Construction
Marysville | July 2026
- Homes for sale
- 117 July 2025: 75 | 56.0% higher
- Went under contract
- 34 July 2025: 10 | 240.0% higher
- Closed sales
- 24 July 2025: 12 | 100.0% higher
- Time to contract*
- 21 days July 2025: 34 days | 13 days faster
- Original asking received*
- 97.8% July 2025: 98.5% | 0.7 points lower
- Median sales price
- $664,995 July 2025: $810,686 | 18.0% lower
New Construction had 117 homes available, 34 pending sales, and 24 closings. Successful sales took 21 days. The middle seller retained 97.8% of original asking price.
Marysville New Construction Summary for July 2026
Compared with July 2025, inventory was 56.0% higher, pending sales were 240.0% higher, and closings were 100.0% higher.
Timing was 13 days faster and the asking-price result was 0.7 points lower. These figures describe successful sales, so property mix, condition, location, and direct competition still matter.
Condominiums
Marysville | July 2026
- Homes for sale
- 21 July 2025: 16 | 31.2% higher
- Went under contract
- 10 July 2025: 4 | 150.0% higher
- Closed sales
- 2 July 2025: 6 | 66.7% lower
- Time to contract*
- 7 days July 2025: 18 days | 11 days faster
- Original asking received*
- 100.9% July 2025: 101.4% | 0.5 points lower
- Median sales price
- $432,475 July 2025: $494,625 | 12.6% lower
Condominiums had 21 homes available, 10 pending sales, and 2 closings. Successful sales took 7 days. The middle seller retained 100.9% of original asking price.
Marysville Condominiums Summary for July 2026
Compared with July 2025, inventory was 31.2% higher, pending sales were 150.0% higher, and closings were 66.7% lower.
Timing was 11 days faster and the asking-price result was 0.5 points lower. These figures describe successful sales, so property mix, condition, location, and direct competition still matter.
Townhouses
Marysville | July 2026
- Homes for sale
- 12 July 2025: 10 | 20.0% higher
- Went under contract
- 7 July 2025: 3 | 133.3% higher
- Closed sales
- 0 July 2025: 0 | new activity
Townhouses had 12 homes available, 7 pending sales, and 0 closings.
Marysville Townhouses Summary for July 2026
Compared with July 2025, inventory was 20.0% higher, pending sales were 133.3% higher, and closings were new activity.
These figures describe successful sales, so property mix, condition, location, and direct competition still matter.
Next, see how residential resale changed across five price ranges.
Continue to price ranges →How Did Marysville Residential Resale Price Ranges Perform?
Each price range below keeps its July inventory, buyer activity, successful-sale speed, showings, negotiation result, and interpretation together.
Under $600K
Marysville | July 2026
- Homes for sale
- 40 July 2025: 30 | 33.3% higher
- Went under contract
- 27 July 2025: 19 | 42.1% higher
- Closed sales
- 24 July 2025: 22 | 9.1% higher
- Time to contract*
- 6 days July 2025: 6 days | unchanged
- Original asking received*
- 100.0% July 2025: 100.0% | unchanged
- Median sales price
- $574,750 July 2025: $553,500 | 3.8% higher
Under $600K had 40 homes available, 27 pending sales, and 24 closings. Successful sales took 6 days. The middle seller retained 100.0% of original asking price.
Marysville Under $600K Summary for July 2026
Compared with July 2025, inventory was 33.3% higher, pending sales were 42.1% higher, and closings were 9.1% higher.
Timing was unchanged and the asking-price result was unchanged. These figures describe successful sales, so property mix, condition, location, and direct competition still matter.
$600K to $749K
Marysville | July 2026
- Homes for sale
- 50 July 2025: 47 | 6.4% higher
- Went under contract
- 25 July 2025: 24 | 4.2% higher
- Closed sales
- 23 July 2025: 21 | 9.5% higher
- Time to contract*
- 10 days July 2025: 10 days | unchanged
- Original asking received*
- 100.0% July 2025: 100.0% | unchanged
- Median sales price
- $655,000 July 2025: $680,000 | 3.7% lower
$600K to $749K had 50 homes available, 25 pending sales, and 23 closings. Successful sales took 10 days. The middle seller retained 100.0% of original asking price.
Marysville $600K to $749K Summary for July 2026
Compared with July 2025, inventory was 6.4% higher, pending sales were 4.2% higher, and closings were 9.5% higher.
Timing was unchanged and the asking-price result was unchanged. These figures describe successful sales, so property mix, condition, location, and direct competition still matter.
$750K to $949K
Marysville | July 2026
- Homes for sale
- 26 July 2025: 19 | 36.8% higher
- Went under contract
- 2 July 2025: 8 | 75.0% lower
- Closed sales
- 5 July 2025: 7 | 28.6% lower
- Time to contract*
- 12 days July 2025: 5 days | 7 days slower
- Original asking received*
- 100.0% July 2025: 100.0% | unchanged
- Median sales price
- $780,000 July 2025: $775,000 | 0.6% higher
$750K to $949K had 26 homes available, 2 pending sales, and 5 closings. Successful sales took 12 days. The middle seller retained 100.0% of original asking price.
Marysville $750K to $949K Summary for July 2026
Compared with July 2025, inventory was 36.8% higher, pending sales were 75.0% lower, and closings were 28.6% lower.
Timing was 7 days slower and the asking-price result was unchanged. These figures describe successful sales, so property mix, condition, location, and direct competition still matter.
$950K or More
Marysville | July 2026
- Homes for sale
- 6 July 2025: 8 | 25.0% lower
- Went under contract
- 3 July 2025: 2 | 50.0% higher
- Closed sales
- 2 July 2025: 2 | unchanged
- Time to contract*
- 40 days July 2025: 65 days | 25 days faster
- Original asking received*
- 91.7% July 2025: 95.7% | 4.0 points lower
- Median sales price
- $1,075,000 July 2025: $1,085,000 | 0.9% lower
$950K or More had 6 homes available, 3 pending sales, and 2 closings. Successful sales took 40 days. The middle seller retained 91.7% of original asking price.
Marysville $950K or More Summary for July 2026
Compared with July 2025, inventory was 25.0% lower, pending sales were 50.0% higher, and closings were unchanged.
Timing was 25 days faster and the asking-price result was 4.0 points lower. These figures describe successful sales, so property mix, condition, location, and direct competition still matter.
You’ve completed the detailed market breakdown. Continue with common questions.
Continue to questions →Neighborhood Competition
Marysville Neighborhood Competition and Standout Sales
Buyers often shop by budget before they shop by neighborhood. These price bands show where inventory accumulated, where closed homes moved fastest, and where sellers kept the most negotiating power.
In Sunnyside, an extensively renovated home on a lot larger than 10,000 square feet sold about 5.15% above asking. Another rambler in a similar starting range went pending in six days and closed about 8.9% above its original list price.
A Cedarcrest-area home near the golf course and Bayview Trail produced one of the clearest reactions of the month. It was positioned to sell quickly, went pending in five days, and closed about 12.18% above asking. Its final price also moved it into the next reporting bracket.
Those sales help explain why the closed-price bands do not always show where buyer competition began. The original list price drew buyers into the conversation. The winning offer determined where the sale was ultimately counted.
This does not mean every home below $750,000 was easy to sell. It means the largest buyer pool was shopping there, and a listing that combined the right price with strong condition, renovations, lot utility, or location had more opportunities to create competition.
Questions Raised by the Data
What Does Marysville's July Market Actually Mean?
Does the citywide median describe every Marysville home?
No. The citywide figures combine different housing types, sizes, conditions, locations, and price ranges. A specific home should be compared with similar properties and its direct competition.
Where did successful residential resale homes move fastest?
The Under $600K range had a median of 6 days among successful sales. That result describes the middle successful sale in that range, not every active listing.
Why can buyers have choices while some homes still receive strong offers?
More inventory gives buyers permission to compare. Homes can still create competition when their price, condition, location, presentation, lot, or rarity makes them stand out from the alternatives.
Complete Market Conclusion
Marysville Housing Market Conclusion for July 2026
Marysville was not one market. Housing type, price range, and the individual property changed the result.
Citywide inventory was 40.9% higher, pending sales were 40.7% higher, and closings were 6.3% higher than in July 2025.
The median successful sale took 13 days and received 99.4% of original asking price. Median sale price was $610,000 and median price per square foot was $361.
Residential Resale: 122 homes were available, 57 went pending, and 54 closed. The successful median was 10 days. The middle seller received 100.0% of asking.
New Construction: 117 homes were available, 34 went pending, and 24 closed. The successful median was 21 days. The middle seller received 97.8% of asking.
Condominiums: 21 homes were available, 10 went pending, and 2 closed. The successful median was 7 days. The middle seller received 100.9% of asking.
Townhouses: 12 homes were available, 7 went pending, and 0 closed.
The resale price ranges below show why the citywide average did not describe every seller. Fast timing or a strong asking-price result in a small sample should be treated as evidence about those particular successful sales, not as a guarantee for every listing.
Under $600K: 40 homes were available, 27 went pending, and 24 closed. Successful sales took 6 days. The middle seller received 100.0% of asking.
$600K to $749K: 50 homes were available, 25 went pending, and 23 closed. Successful sales took 10 days. The middle seller received 100.0% of asking.
$750K to $949K: 26 homes were available, 2 went pending, and 5 closed. Successful sales took 12 days. The middle seller received 100.0% of asking.
$950K or More: 6 homes were available, 3 went pending, and 2 closed. Successful sales took 40 days. The middle seller received 91.7% of asking.
If I had to sum up Marysville in one sentence: buyers had choices, but they still acted when a home made its value, condition, location, or uniqueness clear.
Questions About Your Plans?
Talk With Brandice
I represent buyers and sellers throughout Marysville, Snohomish County, King County, and surrounding communities.
Never Miss the Next Update
Get the Monthly Market Briefing
Receive new city reports, local market shifts, competition insights, and practical takeaways for buyers and sellers. One useful email each month.


Marysville Marysville Whole-City Snapshot Summary for July 2026
Compared with July 2025, inventory was 40.9% higher, pending sales were 40.7% higher, and closings were 6.3% higher.
Timing was unchanged and the asking-price result was unchanged. These figures describe successful sales, so property mix, condition, location, and direct competition still matter.